GitOps on EKS with Weaveworks > Workshop Module 4: How to Build High Performing Team Operations > Install Sample App (PodInfo) > Performance Monitoring
Performance Monitoring
As we’ve made some request using App Mesh lets return to Container Insights to have a look at the App Mesh performnace monitoring.
In the AWS Console make sure you are in CloudWatch.
On the left navigation pane click Performance Monitoring under Container Insights.
In the left most dropdown box choose Prometheus AppMesh and then in the dropdown box next to this select our cluster gitopsworkshop.
When you do this you will see perforamne metrics that are specific to App Mesh. For example:
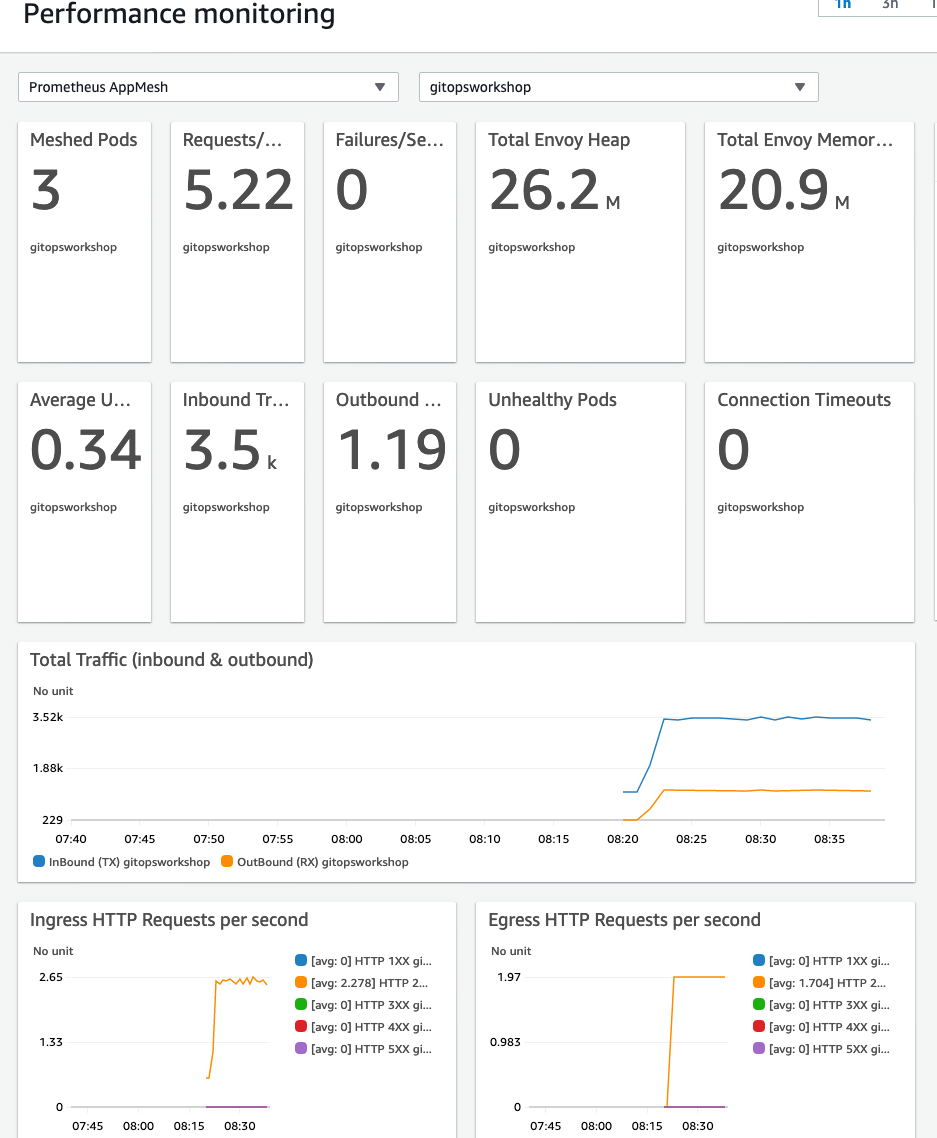
This will show useful metrics such as request per second, number of meshed pods, error codes.